Patrimoine is the breakdown screen. The dashboard answers "how much"; this one answers "made of what". It's where the dashboard's three top figures lead, and the right place to go when a total surprises you.
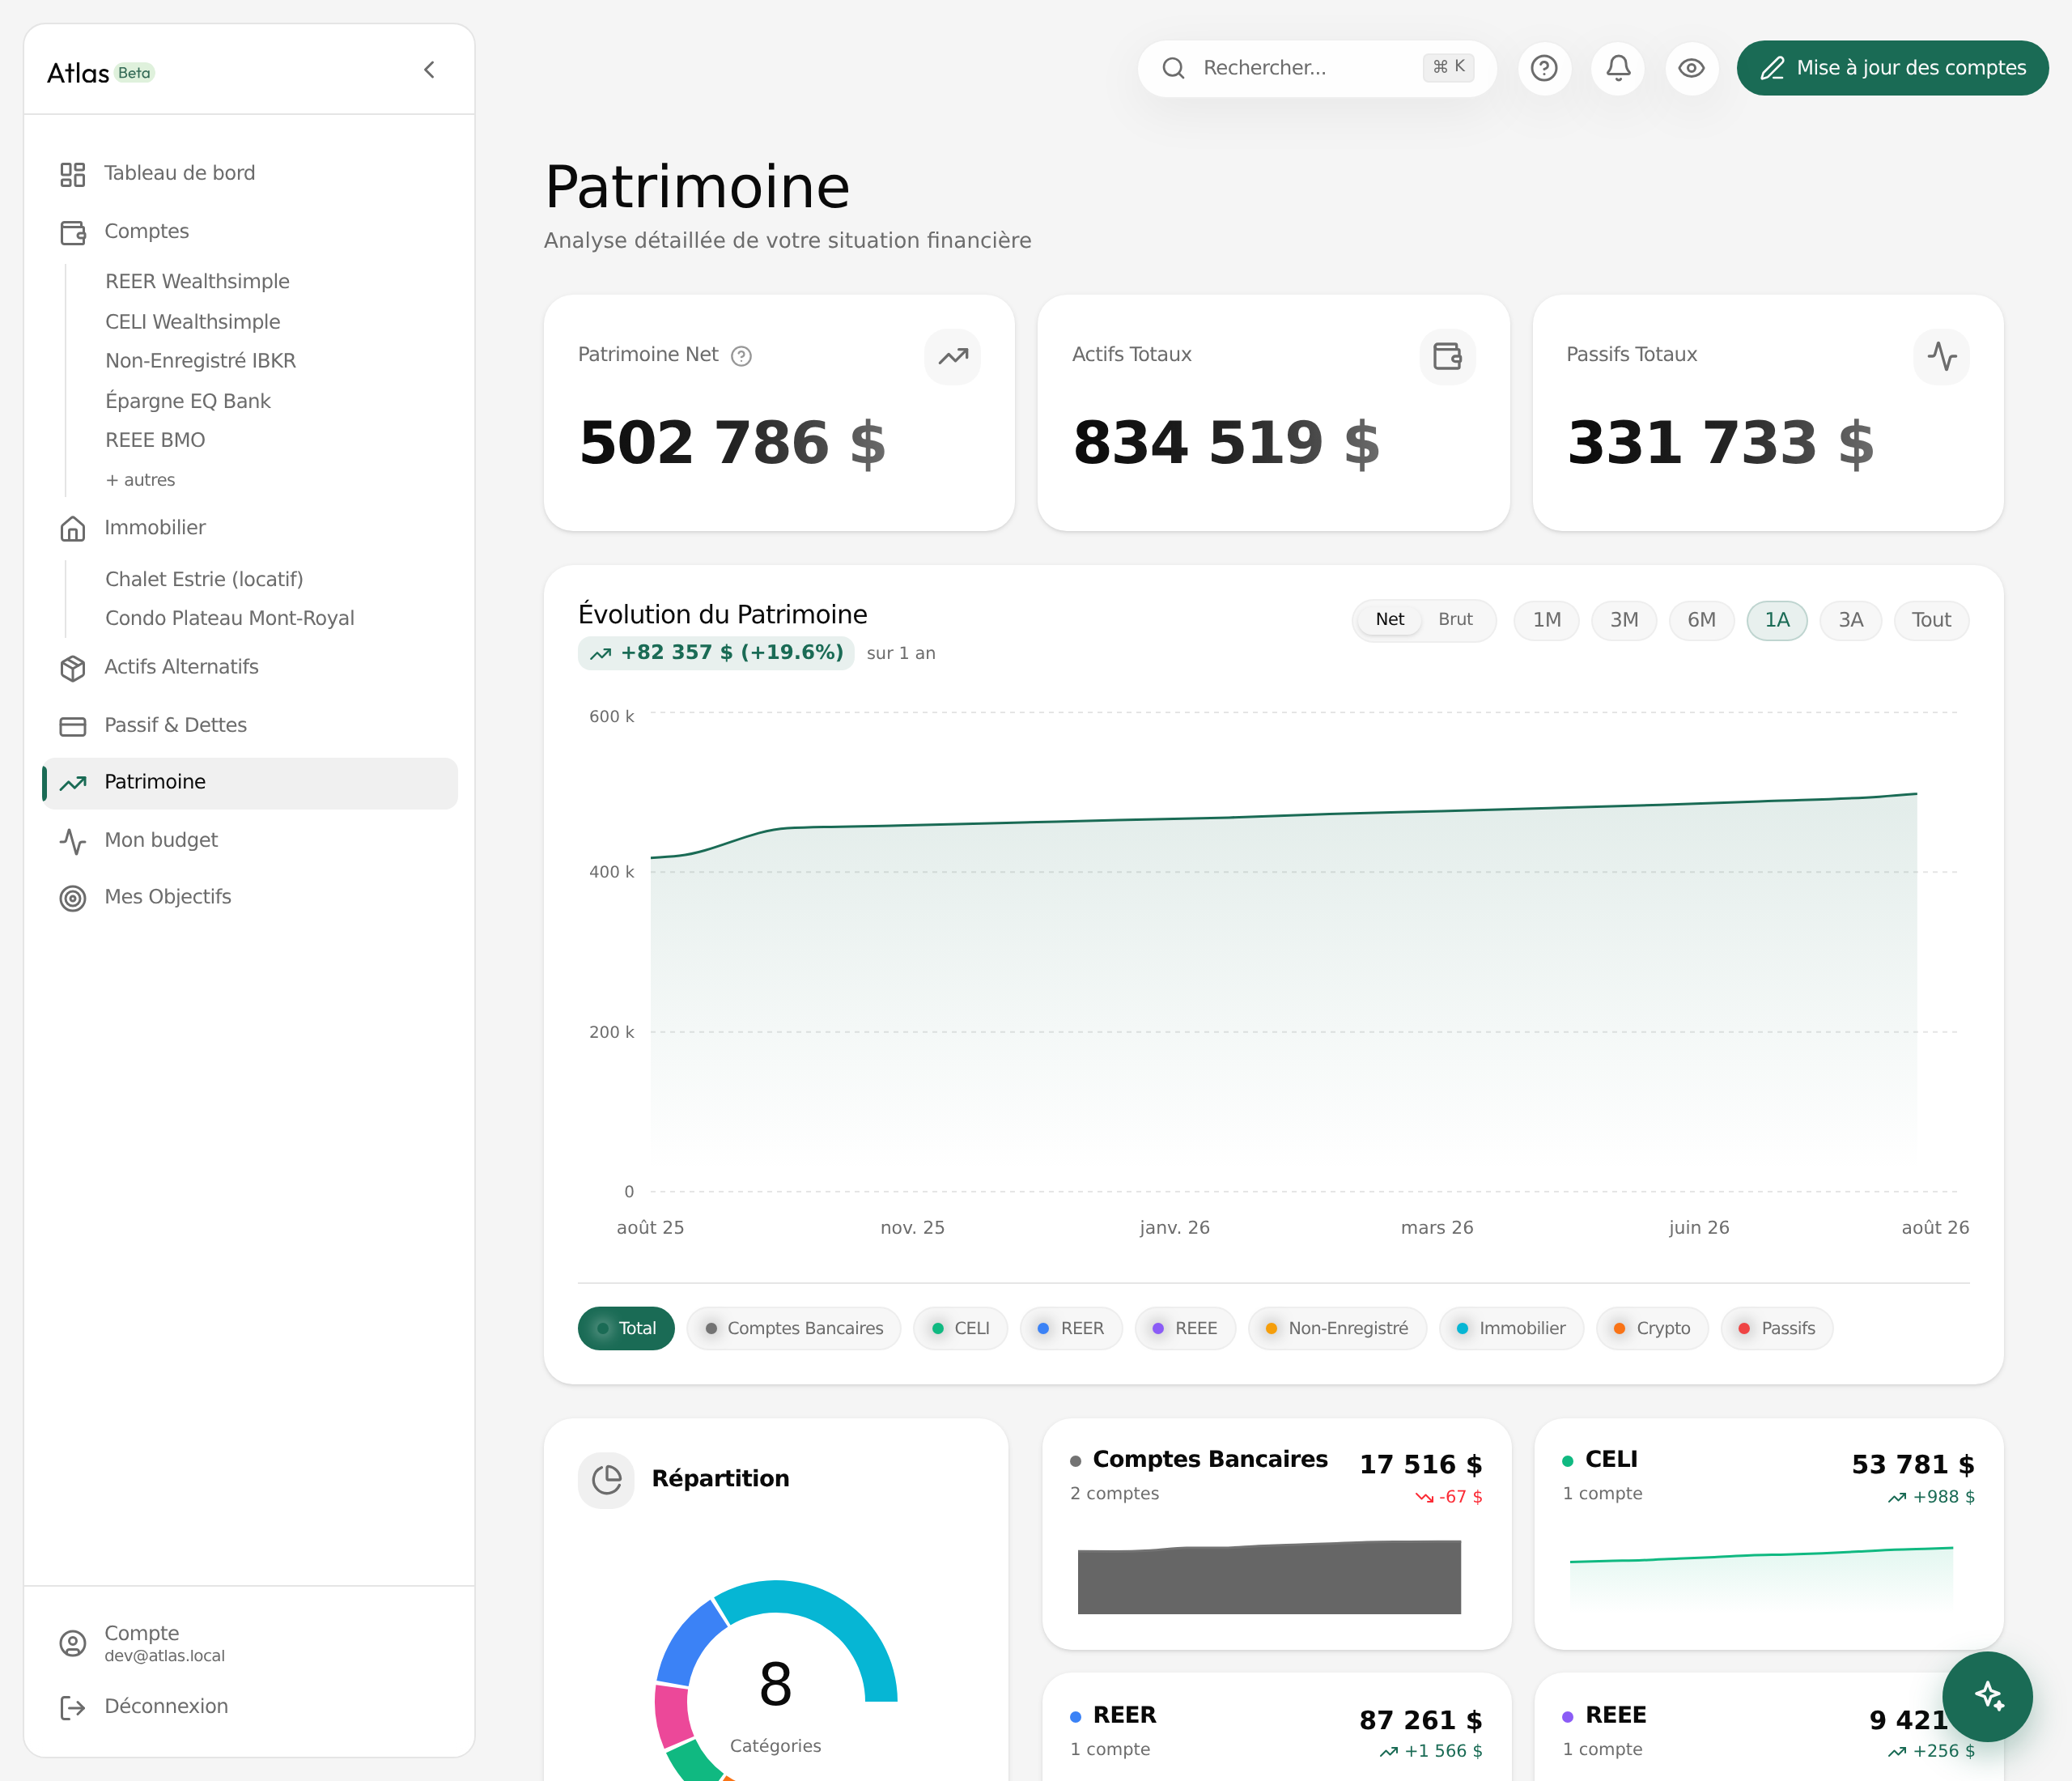
The same figures, broken down
At the top, the three totals you know — net worth, assets, liabilities. Below, the same thing taken apart.
- Wealth evolution — the chart, with the Net / Gross toggle and the six ranges 1M, 3M, 6M, 1Y, 3Y, All. Same mechanics as the dashboard, on a larger surface.
- Breakdown — each category's share, as a pie. A filter above it isolates one category or returns to the total.
- Category detail — the full list, category by category, with its amount and its weight.
The eight categories
Atlas sorts everything you own or owe into eight families:
Bank accounts, TFSA, RRSP, RESP, Non-registered, Real estate, Crypto, Liabilities.
The first five and Crypto come from your accounts. Real estate is the equity of your properties — value minus mortgage, scaled to your share, never the gross value. Liabilities gathers your debts, including those attached to a property.
Using it
Three uses, in order of frequency:
- Check a total that surprises you. The category detail shows immediately which family moved, and by how much.
- Look at your allocation. This is the raw material of the Diversification pillar of the Atlas Score: three families — cash, real estate, markets — and the score rewards combining them rather than stacking one.
- Follow your debt payoff. The Net/Gross toggle separates the trajectory of your saving from that of your debt. Two curves converging is repayment making progress.